CloudStack uses several types of system Instances to perform tasks in the cloud. In general CloudStack manages these system VMs and creates, starts, and stops them as needed based on scale and immediate needs. Unlike user VMs, system VMs are expunged on destroying them. However, the administrator should be aware of them and their roles to assist in debugging issues.
The System VM Template
The System VMs come from a single Template. The System VM has the following characteristics:
Debian 12(bookwork), 6.1.0 kernel with the latest security patches from the Debian security APT repository
Has a minimal set of packages installed thereby reducing the attack surface
64-bit for enhanced performance on Xen/VMWare
pvops kernel with Xen PV drivers, KVM virtio drivers, and VMware tools for optimum performance on all hypervisors
Xen tools inclusion allows performance monitoring
Latest versions of HAProxy, iptables, IPsec, and Apache from debian repository ensures improved security and speed
Latest version of JRE from Sun/Oracle ensures improved security and speed
Starting with 4.20.0 release, the following architectures are supported for KVM hypervisor:
Intel/AMD 64-bit (x86_64)
ARM 64-bit (aarch64)
Other hypervisors only support Intel/AMD 64-bit (x86_64)
System VM Template bundled with packages
The System VM Template is bundled with the official release DEB and RPM cloudstack-management packages for Intel/AMD 64-bit architecture and the following hypervisors:
KVM
VMware
XenServer
Currently, the ARM 64-bit template(s) are not bundled with the packages.
During zone deployment and upgrade, the required templates, i.e., the templates for hypervisor and architecture which are in use in the zone if not already present will be automatically registered and seeded on the secondary storage.
Template(s) will be downloaded from the configured repository
and the same workflow for the registration and seeding will be used.
Repository for downloading the templates can be configured using
/etc/cloudstack/management/server.properties file by updating the
system.vm.templates.download.repository property. If no custom
repository is configured, templates will be downloaded from the default
official repository.
If the automatic download and seeding of template fails, the
template can be registered and seeded manually.
UI/API can be used to register the template if the secondary storage VM is
running in the zone. In case the secondary storage VM is not present then
manual registration and seeding can be done using cloud-install-sys-tmplt
script.
Changing the Default System VM Template
The 64-bit template should be used with a System Offering of at least 512MB of memory.
Based on the hypervisor you use, download the 64-bit Template - e.g. from the following location:
Hypervisor
Architecture
Download Location
XenServer
x86_64
http://download.cloudstack.org/systemvm/4.22/systemvmtemplate-4.22.0-x86_64-xen.vhd.bz2
KVM
x86_64
http://download.cloudstack.org/systemvm/4.22/systemvmtemplate-4.22.0-x86_64-kvm.qcow2.bz2
KVM
aarch64
http://download.cloudstack.org/systemvm/4.22/systemvmtemplate-4.22.0-aarch64-kvm.qcow2.bz2
VMware
x86_64
http://download.cloudstack.org/systemvm/4.22/systemvmtemplate-4.22.0-x86_64-vmware.ova
Hyper-V
x86_64
http://download.cloudstack.org/systemvm/4.22/systemvmtemplate-4.22.0-x86_64-hyperv.vhd.zip
As an administrator, log in to the CloudStack UI
Register the 64-bit Template.
For example: KVM64bitTemplate
While registering the Template, select Routing.
Navigate to Configuration, Global Settings:
Set the name of the 64-bit Template, KVM64bitTemplate, in the ``router.template.kvm`` global parameter.
If you are using a XenServer 64-bit Template, set the name in the ``router.template.xenserver`` global parameter.
If you are using a VMware 64-bit Template, set the name in the ``router.template.vmware`` global parameter.
Any new virtual router created in this Zone automatically picks up this Template.
When using multiple architectures in the Zone, same name can be used for the templates for the different architectures and same hypervisor to allow deployment across them depending on the compute capacity and the zone setting - system.vm.preferred.architecture
Restart the Management Server.
Accessing System VMs
It may sometimes be necessary to access System VMs for diagnostics of certain issues, for example if you are experiencing SSVM (Secondary Storage VM) connection issues. Use the steps below in order to connect to the SSH console of a running System VM.
Accessing System VMs over the network requires the use of private keys and connecting to System VMs SSH Daemon on port 3922. XenServer/KVM Hypervisors store this key at /root/.ssh/id_rsa.cloud on each CloudStack agent. To access System VMs running on ESXi, the key is stored on the management server at ~cloud/.ssh/id_rsa.
Find the details of the System VM
Log in with admin privileges to the CloudStack UI.
Click Infrastructure, then System VMs, and then click the name of a running VM.
Take a note of the ‘Host’, ‘Private IP Address’ and ‘Link Local IP Address’ of the System VM you wish to access.
XenServer/KVM Hypervisors
Connect to the Host of which the System VM is running.
SSH to the ‘Link Local IP Address’ of the System VM from the Host on which the VM is running.
Format: ssh -i <path-to-private-key> <link-local-ip> -p 3922
Example: root@kvm01:~# ssh -i /root/.ssh/id_rsa.cloud 169.254.3.93 -p 3922
ESXi Hypervisors
Connect to your CloudStack Management Server.
ESXi users should SSH to the private IP address of the System VM.
Format: ssh -i <path-to-private-key> <vm-private-ip> -p 3922
Example: root@management:~# ssh -i ~cloud/.ssh/id_rsa 172.16.0.250 -p 3922
Multiple System VM Support for VMware
Every CloudStack zone has single System VM for Template processing tasks such as downloading Templates, uploading Templates, and uploading ISOs. In a zone where VMware is being used, additional System VMs can be launched to process VMware-specific tasks such as taking Snapshots and creating private Templates. The CloudStack management server launches additional System VMs for VMware-specific tasks as the load increases. The management server monitors and weights all commands sent to these System VMs and performs dynamic load balancing and scaling-up of more System VMs.
Console Proxy
The Console Proxy is a type of System Virtual Machine that has a role in presenting a console view via the web UI. It connects the user’s browser to the VNC port made available via the hypervisor for the console of the guest. Both the administrator and end user web UIs offer a console connection.
Clicking a console icon brings up a new window. The console viewer into that window refers to the public IP address of a console proxy VM. There is exactly one public IP address allocated per console proxy VM. The viewer application connects to this IP. The console proxy then proxies the connection to the VNC port for the requested instance on the Host hosting the guest.
Since 4.15, noVNC has been integrated into the console proxy and is the default viewer. It inherently supports multiple keyboard layouts configured in the Guest Instance. Additionally, it can scale the display as well as paste into the console.
noVNC is set as the default console viewer which be changed via the “novnc.console.default” global setting, which is set to true by default.
Note
The hypervisors will have many ports assigned to VNC usage so that multiple VNC sessions can occur simultaneously.
There is never any traffic to the guest virtual IP, and there is no need to enable VNC within the guest.
The console proxy VM will periodically report its active session count to the Management Server. The default reporting interval is five seconds. This can be changed through standard Management Server configuration with the parameter consoleproxy.loadscan.interval.
Assignment of Guest Instance to console proxy is determined by first determining if the Guest Instance has a previous session associated with a console proxy. If it does, the Management Server will assign the guest instance to the target Console Proxy VM regardless of the load on the proxy VM. Failing that, the first available running Console Proxy VM that has the capacity to handle new sessions is used.
Console proxies can be restarted by administrators but this will interrupt existing console sessions for users.
Creating an Instance Console Endpoint
The access to an instance console is created by the API ‘createConsoleEndpoint’, for the instance specified in the parameter ‘virtualmachineid’. By default, the CloudStack UI connects to the URL that this API generates.
The response of the ‘createConsoleEndpoint’ API also contain the information to create a websocket session to the VNC server on the console proxy, this information includes: the host, port, path and token parameters required to establish a websocket session, bypassing the VNC client on the console proxy.
It is possible to add extra validation for the console proxy authentication, with the following configurations:
‘consoleproxy.extra.security.validation.enabled’: Enable/disable extra security validation for console proxy using a token
When ‘consoleproxy.extra.security.validation.enabled’ is true: then CloudStack requests the ‘token’ parameter to the ‘createConsoleEndpoint’ API. The console URL retrieved on the API response includes an ‘extra’ parameter for users validation on the console proxy.
When the console proxy receives a request including the ‘extra’ parameter it will decode the ‘token’ parameter and uses the original token to compare it with the ‘extra’ token. Only in case both matches, then the console access is allowed.
When ‘consoleproxy.extra.security.validation.enabled’ is false: then CloudStack does not require a token for validation.
The websocket port is passed as a boot argument to the console proxy and the management server decides between the secure or insecure port (8443 or 8080) when setting the boot arguments for the CPVM.
The secure port 8443 is sent as a boot argument when:
The setting ‘consoleproxy.sslEnabled’ is true
The setting ‘consoleproxy.url.domain’ is not empty
There is a record on the ‘keystore’ database with name ‘CPVMCertificate’
In any other case, then the port 8080 is selected
Administrators must ensure a new console proxy VM is recreated after changing the value of any of the settings. Once the console proxy VM is recreated, the new VNC server port will be used as the websocket traffic port. The console proxy VM startup will also ensure a new iptable rule is added for the new VNC port, allowing the traffic on it.
Using a SSL Certificate for the Console Proxy
By default, the console viewing functionality uses plaintext HTTP. In any production environment, the console proxy connection should be encrypted via SSL at the minimum.
A CloudStack administrator has 2 ways to secure the console proxy communication with SSL:
Set up a SSL wild-card certificate and domain name resolution
Set up SSL certificate for specific FQDN and configure a load-balancer with optional ssl offloading.
Changing the Console Proxy SSL Certificate and Domains
The administrator can configure SSL encryption by selecting a domain and uploading a new SSL certificate and private key. The domain must run a DNS service that is capable of resolving queries for addresses of the form aaa-bbb-ccc-ddd.your.domain to an IPv4 IP address in the form aaa.bbb.ccc.ddd, for example, 202.8.44.1. To change the console proxy domain, SSL certificate, and private key:
Set up dynamic name resolution or populate all possible DNS names in your public IP range into your existing DNS server with the format aaa-bbb-ccc-ddd.consoleproxy.company.com -> aaa.bbb.ccc.ddd.
Note
In these steps you will notice consoleproxy.company.com -For security best practices, we recommend creating a wildcard SSL certificate on a separate subdomain so in the event that the certificate is compromised, a malicious user cannot impersonate a company.com domain.
Generate the private key and certificate signing request (CSR). When you are using openssl to generate private/public key pairs and CSRs, for the private key that you are going to paste into the CloudStack UI, be sure to convert it into PKCS#8 format.
Generate a new 2048-bit private key
openssl genrsa -des3 -out yourprivate.key 2048
Generate a new certificate CSR. Ensure the creation of a wildcard certificate, eg
*.consoleproxy.company.comopenssl req -new -key yourprivate.key -out yourcertificate.csr
Head to the website of your favourite trusted Certificate Authority, purchase an SSL certificate, and submit the CSR. You should receive a valid certificate in return
Convert your private key format into PKCS#8 encrypted format.
openssl pkcs8 -topk8 -in yourprivate.key -out yourprivate.pkcs8.encrypted.key
Convert your PKCS#8 encrypted private key into the PKCS#8 format that is compliant with CloudStack
openssl pkcs8 -in yourprivate.pkcs8.encrypted.key -out yourprivate.pkcs8.key
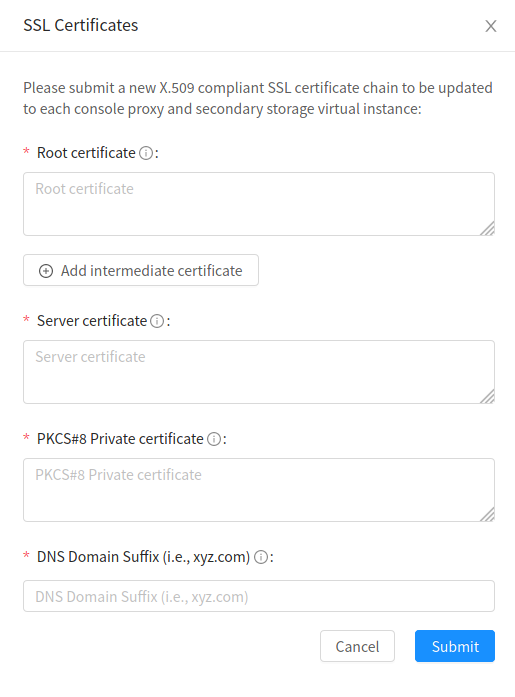
In the Update SSL Certificate screen of the CloudStack UI, paste the following:
The certificate you’ve just generated.
The private key you’ve just generated.
The desired domain name, prefixed with
*.; for example,*.consoleproxy.company.com
This stops all currently running console proxy VMs, then restarts them with the new certificate and key. Users might notice a brief interruption in console availability.
The Management Server generates URLs of the form “aaa-bbb-ccc-ddd.consoleproxy.company.com” after this change is made. The new console requests will be served with the new DNS domain name, certificate, and key.
Uploading ROOT CA and Intermediate CA
If you need to upload custom certificate with ROOT CA and intermediate CA, you can find more details here: https://cwiki.apache.org/confluence/display/CLOUDSTACK/Procedure+to+Replace+realhostip.com+with+Your+Own+Domain+Name
IMPORTANT NOTES:
In order to avoid errors and problems while uploading custom certificates, please check following:
1. While doing URL encoding of ROOT CA and any Intermediate CA, be sure that the plus signs (“+”) inside certificates are not replaced by space (” “), because some URL/string encoding tools tend to do that.
2. If you are renewing certificates it might happen you need to upload new ROOT CA and Intermediate CA, together with new Server Certificate and key. In this case please be sure to use same names for certificates during API upload of certificate, example:
http://123.123.123.123:8080/client/api?command=uploadCustomCertificate&…&name=root1… http://123.123.123.123:8080/client/api?command=uploadCustomCertificate&…&name=intermed1…
Here names are “root1” and “intermed1”. If you used other names previously, please check the cloud.keystore table to obtain used names.
If you still have problems and following errors in management.log while destroying CPVM:
Unable to build keystore for CPVMCertificate due to CertificateException
Cold not find and construct a valid SSL certificate
that means that still some of the Root/intermediate/server certificates or the key is not in a good format, or incorrectly encoded or multiply Root CA/Intermediate CA present in database by mistake.
Other way to renew Certificates (Root,Intermediates,Server certificates and key) - although not recommended unless you fill comfortable - is to directly edit the database, while still respect the main requirement that the private key is PKCS8 encoded, while Root CA, Intermediate and Server certificates are still in default PEM format (no URL encoding needed here). After editing the database, please restart management server, and destroy SSVM and CPVM after that, so the new SSVM and CPVM with new certificates are created.
Load-balancing Console Proxies / Secondary Storage VMs
An alternative to using dynamic DNS or creating a range of DNS entries as described in the last section would be to create a SSL certificate for a specific domain name, configure CloudStack to use that particular FQDN, and then configure a load balancer to load balance the console proxy’s IP address behind the FQDN. When using a load balancer it is also possible to perform SSL-Offloading, so no certificate needs to be configured on CloudStack itself. For further information please see https://cwiki.apache.org/confluence/display/CLOUDSTACK/Realhost+IP+changes for more details.
These ports needed to be configured for load-balancing:
443 to 443 (to CPVM)
8080 to 8080 (to CPVM)
443 to 443 (to SSVM)
SSL-Offloading with Load-balancing for Console Proxies / Secondary Storage VMs
To implement SSL-Offloading you need 2 public IP addresses (one for Console Proxy and one for Secondary Storage VM) which each of them resolve to a different FQDN and terminate at the load balancer. Also 3 global settings need to be edited.
The setting ‘consoleproxy.url.domain’ to the FQDN used by the certificate (For example: cpvm.company.com)
The setting ‘secstorage.ssl.cert.domain’ to the FQDN used by the certificate (For example: ssvm.company.com)
The setting ‘secstorage.encrypt.copy’ to true
Warning
For sake of security you should block direct public access to the IP of Console Proxy and Secondary Storage VM. It is also possible to add a fake public IP range to CloudStack which uses internal IP addresses for SystemVM use only. Please be aware that the load balancer needs access to the used IP addresses to forward traffic.
After edited global settings mentioned above you need to recreate both System VMs by destroying them. CloudStack will recreate them with the new settings automatically.
When using SSL-Offloading you need to configure following ports on the load balancer after adding the correct certificate to the public IP of each FQDN:
lb-publicip1:443 to CPVM:80
lb-publicip1:8080 to CPVM:8080
lb-publicip2:443 to SSVM:80
Virtual Router
The virtual router is a type of System Virtual Machine. The virtual router is one of the most frequently used service providers in CloudStack. The end user has no direct access to the virtual router. Users can ping the virtual router and take actions that affect it (such as setting up port forwarding), but users do not have SSH access into the virtual router.
There is no mechanism for the administrator to log in to the virtual router. Virtual routers can be restarted by administrators, but this will interrupt public network access and other services for end users. A basic test in debugging networking issues is to attempt to ping the virtual router from a Guest Instance. Some of the characteristics of the virtual router are determined by its associated system service offering.
Configuring the Virtual Router
You can set the following:
IP range
Supported network services
Default domain name for the network serviced by the virtual router
Gateway IP address
How often CloudStack fetches network usage statistics from CloudStack virtual routers. If you want to collect traffic metering data from the virtual router, set the global configuration parameter router.stats.interval. If you are not using the virtual router to gather network usage statistics, set it to 0.
Upgrading a Virtual Router with System Service Offerings
When CloudStack creates a virtual router, it uses default settings which are defined in a default system service offering. See “System Service Offerings”. All the virtual routers in a single guest network use the same system service offering. You can upgrade the capabilities of the virtual router by creating and applying a custom system service offering.
Define your custom system service offering. See “Creating a New System Service Offering”. In System VM Type, choose Domain Router.
Associate the system service offering with a network offering. See “Creating a New Network Offering”.
Apply the network offering to the network where you want the virtual routers to use the new system service offering. If this is a new network, follow the steps in Adding an Additional Guest Network on page 66. To change the service offering for existing virtual routers, follow the steps in “Changing the Network Offering on a Guest Network”.
Best Practices for Virtual Routers
WARNING: Restarting a virtual router from a hypervisor console deletes all the iptables rules. To work around this issue, stop the virtual router and start it from the CloudStack UI.
Warning
Do not use the destroyRouter API when only one router is available in the network, because restartNetwork API with the cleanup=false parameter can’t recreate it later. If you want to destroy and recreate the single router available in the network, use the restartNetwork API with the cleanup=true parameter.
Service Monitoring Tool for Virtual Router
Various services running on the CloudStack virtual routers can be
monitored by using a Service Monitoring tool. The tool ensures that
services are successfully running until CloudStack deliberately disables
them. If a service goes down, the tool automatically attempts to restart
service, and if that does not help bringing up the service, an alert as
well as an event is generated indicating the failure. A new global
parameter, network.router.enableservicemonitoring, has been
introduced to control this feature. The default value is false, implies,
monitoring is disabled. When you enable, ensure that the Management
Server and the router are restarted.
Monitoring tool can help to start a VR service, which is crashed due to an unexpected reason. For example:
The services crashed due to defects in the source code.
The services that are terminated by the OS when memory or CPU is not sufficiently available for the service.
Note
Only those services with daemons are monitored. The services that are failed due to errors in the service/daemon configuration file cannot be restarted by the Monitoring tool. VPC Networks are supported (as of CloudStack 4.14)
The following services are monitored in a VR:
DNS (dnsmasq)
HAProxy (haproxy)
SSH (sshd)
Apache Web Server (apache2)
The following networks are supported:
Isolated Networks
Shared Networks in both Advanced and Basic zone
VPC (as of CloudStack 4.14)
This feature is supported on the following hypervisors: XenServer, VMware, and KVM.
Log file /var/log/routerServiceMonitor.log contains the actions undertaken/attempted by the service monitoring script (i.e. trying to restart a stopped service).
As of CloudStack 4.14, the interval at which the service monitoring script runs is no more hardcoded to 3 minutes, but is instead controlled via global setting router.health.checks.basic.interval.
Health checks for Virtual Router
In addition to monitoring services as of 4.14 CloudStack adds a framework for more extensive health checks. The health checks are split into two categories - basic and advanced. The two categories have their own admin definable intervals. The split is made this way as the advanced health checks are considerably more expensive. The health checks will be available on-demand via API as well as scheduled.
The following tests are covered: · Basic connectivity from the management server to the virtual router
Basic connectivity to virtual router its interfaces’ gateways
Free disk space on virtual router’s disk
CPU and memory usage
Basic VR Sanity checks:
Ssh/dnsmasq/haproxy/httpd service running
Advanced VR Sanity checks:
DHCP/DNS configuration matches mgmt server DB
IPtables rules match management server records
HAproxy config matches mgmt server DB records
VR Version against current version
This happens in the following steps:
1. Management server periodically pushes data to each running virtual router including schedule intervals, tests to skip, some configuration for LB, instances, Gateways, etc.
2. Basic and advanced tests as scheduled as per the intervals in the data sent by Management server. Each run of checks populates it’s results and saves it within the router at ‘/root/basic_monitor_results.json’ and ‘/root/advance_monitor_results.json’. Each run of checks also keeps track of the start time, end time, and duration of test run for better understanding.
3. Each test is also available on demand via ‘ getRouterHealthCheckResults’ API added with the patch. The API can be executed from CLI and UI. Performing fresh checks is expensive and will cause management server doing the following:
a. Refresh the data from Management server records on the router for verification (repeat of step 1),
Run all the checks of both basic and advanced type,
Fetch the result of the health check from router to be sent back in response.
4. The patch also supports custom health checks with custom systemVM Templates. This is achieved as follows:
a. Each executable script placed in ‘/root/health_scripts/’ is considered an independent health check and is executed on each scheduled or on demand health check run.
b. The health check script can be in any language but executable (use ‘chmod a+x’) within ‘/root/health_checks/’ directory. The placed script must do the following:
#. Accept a command line parameter for check type (basic or advanced) - this parameter is sent by the internal cron job in the VR (/etc/cron.d/process)
Proceed and perform checks as per the check type - basic or advanced
#. In order to be recognized as a health check and displayed in the list of health checks results, it must print some message to STDOUT which is passed back as message to management server - if the script doesn’t return anything on its STDOUT, it will not be registered as a health check/displayed in the list of the health check results
#. exit with status of 0 if check was successful and exit with status of 1 if check has failed
#!/bin/bash if [$1 == ‘advanced’] { do advance checks and print any message to STDOUT }
else if [$1 == ‘basic’] { do basic checks and print any message to STDOUT } exit(0) if pass or exit(1) if failure
#. i.e. if the script is intended to be i.e. a basic check, it must checks for the presence of the ‘basic’ as the first parameter sent to it, and execute the wanted commands and print some output to STDOUT; otherwise if it receives ‘advanced’ as the first parameter, it should not execute any commands/logic nor print anything to STDOUT
5. There are 9 health check scripts written in default systemvm Template in ‘/root/health_checks/’ folder. These indicate the health checks described in executive summary.
6. The management server will connect periodically to each virtual router to confirm that the
checks are running as scheduled, and retrieve the results of those checks. Any failing checks
present in router.health.checks.failures.to.restart.vr will cause the VR to be recreated.
On each check management server will persist only the last executed check results in its database.
7. UI parses the returned health check results and shows the router ‘Health Check’ column in ‘Failed’/’Passed’ if there are health check failures of any type.
Following global configs have been added for configuring health checks:
router.health.checks.enabled- If true, router health checks are allowed to be executed and read. If false, all scheduled checks and API calls for on demand checks are disabled. Default is true.
router.health.checks.basic.interval- Interval in minutes at which basic router health checks are performed. If set to 0, no tests are scheduled. Default is 3 mins as per the pre 4.14 monitor services.
router.health.checks.advanced.interval- Interval in minutes at which advanced router health checks are performed. If set to 0, no tests are scheduled. Default value is 10 minutes.
router.health.checks.config.refresh.interval- Interval in minutes at which router health checks config - such as scheduling intervals, excluded checks, etc is updated on virtual routers by the management server. This value should be sufficiently high (like 2x) from the router.health.checks.basic.interval and router.health.checks.advanced.interval so that there is time between new results generation for passed data. Default is 10 mins.
router.health.checks.results.fetch.interval- Interval in minutes at which router health checks results are fetched by management server. On each result fetch, management server evaluates need to recreate VR as per configuration of ‘router.health.checks.failures.to.recreate.vr’. This value should be sufficiently high (like 2x) from the ‘router.health.checks.basic.interval’ and ‘router.health.checks.advanced.interval’ so that there is time between new results generation and fetch.
router.health.checks.failures.to.recreate.vr- Health checks failures defined by this config are the checks that should cause router recreation. If empty the recreate is not attempted for any health check failure. Possible values are comma separated script names from systemvm’s /root/health_scripts/ (namely - cpu_usage_check.py, dhcp_check.py, disk_space_check.py, dns_check.py, gateways_check.py, haproxy_check.py, iptables_check.py, memory_usage_check.py, router_version_check.py), connectivity.test or services (namely - loadbalancing.service, webserver.service, dhcp.service)
router.health.checks.to.exclude- Health checks that should be excluded when executing scheduled checks on the router. This can be a comma separated list of script names placed in the ‘/root/health_checks/’ folder. Currently the following scripts are placed in default systemvm Template - cpu_usage_check.py, disk_space_check.py, gateways_check.py, iptables_check.py, router_version_check.py, dhcp_check.py, dns_check.py, haproxy_check.py, memory_usage_check.py.
router.health.checks.free.disk.space.threshold- Free disk space threshold (in MB) on VR below which the check is considered a failure. Default is 100MB.
router.health.checks.max.cpu.usage.threshold- Max CPU Usage threshold as % above which check is considered a failure.
router.health.checks.max.memory.usage.threshold- Max Memory Usage threshold as % above which check is considered a failure.
The scripts for following health checks are provided in ‘/root/health_checks/’. These are not exhaustive and can be modified for covering other scenarios not covered. Details of individual checks:
Basic checks:
a. Services check (ssh, dnsmasq, httpd, haproxy)– this check is still done as per existing monitorServices.py script and any services not running are attempted to be restarted.
b. Disk space check against a threshold – python’s ‘ statvfs’ module is used to retrieve statistics and compare with the configured threshold given by management server.
c. CPU usage check against a threshold – we use ‘top’ utility to retrieve idle CPU and compare that with the configured max CPU usage threshold given by management server.
d. Memory usage check against a threshold – we use ‘free’ utility to get the used memory and compare that with the configured max memory usage threshold.
e. Router Template and scripts version check – is done by comparing the contents of the ‘/etc/cloudstack-release’ and ‘/var/cache/cloud/cloud-scripts-signature’ with the data given by management server.
f. Connectivity to the gateways from router – this is done by analysing the success or failure of ping to the gateway IPs given by management server.
Advanced checks:
a. DNS config match against MS – this is checked by comparing entries of ‘/etc/hosts’ on the VR and instance records passed by management server.
b. DHCP config match against MS – this is checked by comparing entries of ‘/etc/dhcphosts.txt’ on the VR with the instance entries passed by management server.
c. HA Proxy config match against MS (internal LB and public LB) - this is checked by verifying the max connections, and entries for each load balancing rule in the ‘/etc/haproxy/haproxy.cfg’ file. We do not check for stickiness properties yet.
d. Port forwarding match against MS in iptables. - this is checked by verifying IPs and ports in the ‘iptables-save’ command output against an expected list of entries from management server.
Enhanced Upgrade for Virtual Routers
Upgrading VR is made flexible. The CloudStack administrators will be able to control the sequence of the VR upgrades. The sequencing is based on Infrastructure hierarchy, such as by Cluster, Pod, or Zone, and Administrative (Account) hierarchy, such as by Tenant or Domain. As an administrator, you can also determine when a particular customer service, such as VR, is upgraded within a specified upgrade interval. Upgrade operation is enhanced to increase the upgrade speed by allowing as many upgrade operations in parallel as possible.
During the entire duration of the upgrade, users cannot launch new services or make changes to an existing service.
Additionally, using multiple versions of VRs in a single instance is supported. In the Details tab of a VR, you can view the version and whether it requires upgrade. During the Management Server upgrade, CloudStack checks whether VR is at the latest version before performing any operation on the VR. To support this, a new global parameter, ``router.version.check``, has been added. This parameter is set to true by default, which implies minimum required version is checked before performing any operation. No operation is performed if the VR is not at the required version. Services of the older version VR continue to be available, but no further operations can be performed on the VR until it is upgraded to the latest version. This will be a transient state until the VR is upgraded. This will ensure that the availability of VR services and VR state is not impacted due to the Management Server upgrade.
The following service will be available even if the VR is not upgraded. However, no changes for any of the services can be sent to the VR, until it is upgraded:
SecurityGroup
User Data
DHCP
DNS
LB
Port Forwarding
VPN
Static NAT
Source NAT
Firewall
Gateway
NetworkACL
Supported Virtual Routers
VR
VPC VR
Redundant VR
Upgrading Virtual Routers
Download the latest System VM Template.
Download the latest System VM to all the primary storage pools.
Upgrade the Management Server.
Upgrade CPVM and SSVM either from the UI or by using the following script:
# cloudstack-sysvmadm -d <IP address> -u cloud -p -sEven when the VRs are still on older versions, existing services will continue to be available to the instances. The Management Server cannot perform any operations on the VRs until they are upgraded.
Selectively upgrade the VRs:
Log in to the CloudStack UI as the root administrator.
In the left navigation, choose Infrastructure.
On Virtual Routers, click View More.
All the VRs are listed in the Virtual Routers page.
In Select View drop-down, select desired grouping based on your requirement.
You can use either of the following:
Group by zone
Group by pod
Group by cluster
Group by account
Click the group which has the VRs to be upgraded.
For example, if you have selected Group by zone, select the name of the desired zone.
Click the Upgrade button to upgrade all the VRs.

Click OK to confirm.
Secondary Storage VM
In addition to the hosts, CloudStack’s Secondary Storage VM mounts and writes to secondary storage.
Submissions to secondary storage go through the Secondary Storage VM. The Secondary Storage VM can retrieve Templates and ISO images from URLs using a variety of protocols.
The secondary storage VM provides a background task that takes care of a variety of secondary storage activities: downloading a new Template to a Zone, copying Templates between Zones, and Snapshot backups.
The administrator can log in to the secondary storage VM if needed.
Migrating System VMs
System VMs (any of the Console Proxy VM, Secondary Storage VM, Virtual Router or Load Balancer) can be migrated across hosts using migrateSysteVm API or migrate action in the UI. These VMs can be migrated between hosts of the same cluster only.
Since CloudStack 4.16, for VMware, migration of System VMs can also be done to a destination host in a different cluster belonging to the same pod (in case of cluster-wide primary storage pools, this will cause the Root volume of the system VM to be migrated to the appropriate datastore in the new cluster). Storage migration of stopped System VMs is also supported.
Customizing System VMs
CloudStack supports User Data for System VMs at boot time. The default root administrator can supply initialization scripts or configuration to automate tasks such as installing additional packages, setting environment variables, or configuring telemetry. Ensure that the User Data is valid for cloud-init. Invalid content may prevent a System VM from functioning correctly.
Initialization is performed by a CloudStack service, not by the systemd cloud-init unit, to avoid conflicts with CloudStack System VM services.
Warning
User Data offers powerful customization, but inappropriate or intrusive scripts can destabilize or break System VMs. Avoid modifying critical services or networking unless you fully understand the impact, and always test changes in a non-production environment before rollout.
To enable and configure User Data for System VMs:
Create a User Data entry under the default root administrator account.
Set the global setting
systemvm.userdata.enabledtotrue.Provide the ID of the User Data per System VM type using the following global settings:
Global Setting
Description
console.proxy.vm.userdataID of the User Data for Console Proxy VMs
secstorage.vm.userdataID of the User Data for Secondary Storage VMs
virtual.router.userdataID of the User Data for Virtual Routers, VPC VR, internal LB Instances, and elastic LB Instances
Destroy the System VMs and allow CloudStack to re-deploy them to apply the changes.
Note
Only the default root administrator can set the global settings for System VM User Data. The associated User Data entries must also be created under the default root administrator account.
Note
The size of the User Data that can be sent is dependent on the hypervisor. This is because of the way it is provided to the system VM. The user data is compressed and encoded in base64 format when it is provided to the system VM along with other system VM configurations.
KVM: Uses QEMU Guest Agent to write configuration directly to
/var/cache/cloud/cmdlineinside the VMXenServer (HVM): Stores in XenStore key
vm-data/cloudstack/initVMware: Sets as
machine.idextraConfig parameter
The operator needs to ensure that the user data is within the limits of the hypervisor.
Troubleshoot networks from System VMs
For troubleshooting of network issues in CloudStack hosted networks, CloudStack allows the administrator to execute network-utility commands (ping, traceroute or arping) remotely on system VMs.
To run either a ping, traceroute or arping through the CloudStack UI:
As an administrator, log in to the CloudStack UI.
Navigate to Infrastructure > System VMs or Virtual Routers.
Click on the Run Diagnostics button.

- A form will pop up similar to this;
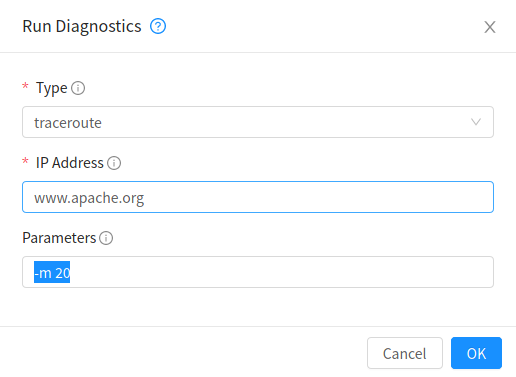
Fill in the details and click OK.
The Extra Args parameter is for specifying command line optional parameters as one would when executing any of the tools from the terminal or command line.
The supported versions are Debian 10 based since system VMs are built using the same Debian 10 based Templates.
Non-Alphanumeric characters (metacharacters) are not allowed for this parameter except for the “-“ and the “.”. Any metacharacter supplied will immediately result in an immediate termination of the command and report back to the operator that an illegal character was passed
Get Diagnostics Data
For further troubleshooting, a set of files can be retrieved from any system VM by using the Get Diagnostics feature, either via the UI or an API call. The files are compressed and a URL is returned where the diagnostics data can be retrieved.
As an administrator, log in to the CloudStack UI.
Navigate to Infrastructure > System VMs or Virtual Routers.
Click on the Get Diagnostics button.

A form will pop up similar to this;
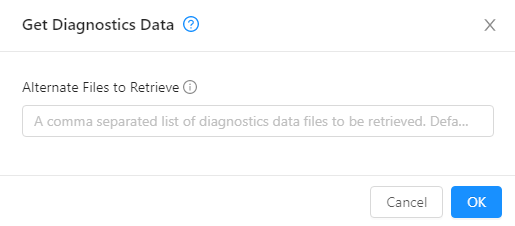
Click OK.
Wait for the URL to generate and click it to download the zipped up diagnostics files.
The following files are retrieved by default for the Virtual Router and is configurable using a global setting: ‘diagnostics.data.router.defaults’
iptables, ipaddr, iproute, /etc/cloudstack-release, /etc/dnsmasq.conf, /etc/dhcphosts.txt, /etc/dhcpopts.txt, /etc/dnsmasq.d/cloud.conf, /etc/dnsmasq-resolv.conf, /var/lib/misc/dnsmasq.leases, /var/log/dnsmasq.log, /etc/hosts, /etc/resolv.conf, /etc/haproxy/haproxy.cfg, /var/log/haproxy.log, /etc/ipsec.d/l2tp.conf, /var/log/cloud.log, /var/log/routerServiceMonitor.log, /var/log/daemon.log”
The following files are retrieved by default for the Secondary Storage VM and Console Proxy VM and is configurable using a global setting: ‘diagnostics.data.systemvm.defaults’
“iptables, ipaddr, iproute, /etc/cloudstack-release, /usr/local/cloud/systemvm/conf/agent.properties, /usr/local/cloud/systemvm/conf/consoleproxy.properties, /var/log/cloud.log, /var/log/patchsystemvm.log /var/log/daemon.log”
These global settings are all dynamic and do not require a restart of the management server in order for changes to be effective. The names wrapped in square brackets are for data types that need to first execute a script in the system vm and grab output for retrieval, e.g. the output from iptables-save is written to a file which will then be retrieved. This also allows an admin to pack their own custom scripts in the system VMs that can be executed and their output will be redirected to a text file that will be retrieved.
The API also has an optional parameter ‘files’ which can be used for retrieving specific files. This parameter has to be the absolute path to where the file exists on the file system.
The output from any command/script can be retrieved by wrapping the name with square brackets which will be executed and its output redirected to a file with a name similar to the name in square brackets in lower case. For example, a user can package their own custom script in the system VM called myscript.py/sh, the user will then retrieve output of this script by specifying it as ‘[MYSCRIPT]’ as either input parameter to files or setting it as a global setting. the API will then execute this script and redirect its output to a file called ‘myscript.log’. This could also be any command that can be executed from the shell and its output will be gathered and retrieved.
Additional global settings can be configured related to garbage collection of generated diagnostics data files and are as follows:
diagnostics.data.gc.enable
Enables the garbage collector background task to delete old files. Changing this setting requires a management server restart. The default value is True
diagnostics.data.gc.interval
The interval at which the garbage collector background tasks in seconds. This setting requires a management server restart. The default value is 86400 (Once a day).
diagnostics.data.retrieval.timeout
The overall system VM script execution time out in seconds. This setting does not require a management server restart. The default value is 1800.
diagnostics.data.max.file.age
Sets the maximum time in seconds a file can stay in storage before it is deleted. The default value is 86400 (1 day).
diagnostics.data.disable.threshold
Sets the secondary storage disk utilisation percentage for file retrieval. An exception is thrown when no secondary store is found with a lower capacity than the specified value. The default value is 0.95 (95 %).